PieChart饼状图
创建饼状图
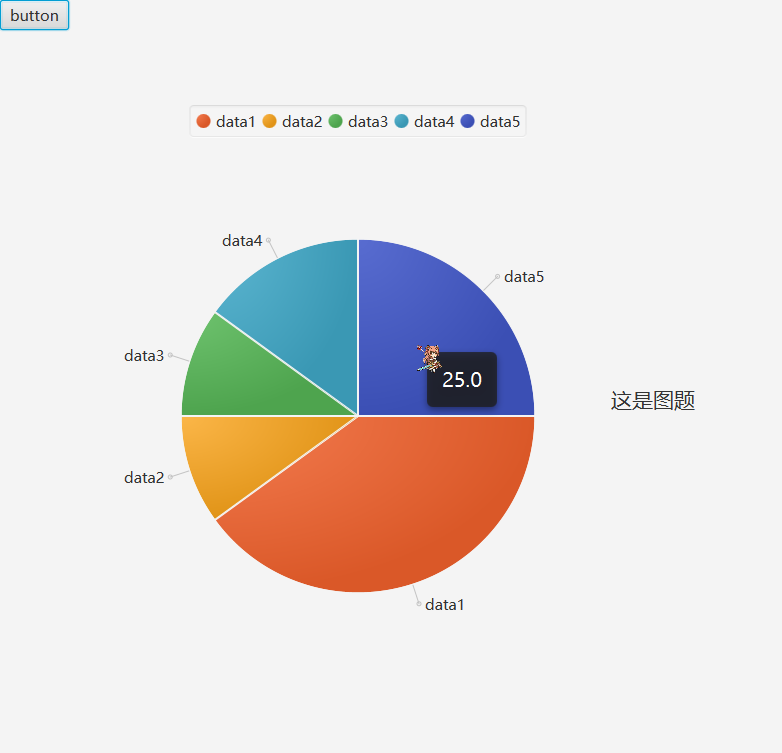
// 所有的data中的value不需要总和为100,只是演示时便于观察
PieChart.Data data1 = new PieChart.Data("data1", 40);
PieChart.Data data2 = new PieChart.Data("data2", 10);
PieChart.Data data3 = new PieChart.Data("data3", 10);
PieChart.Data data4 = new PieChart.Data("data4", 15);
PieChart.Data data5 = new PieChart.Data("data5", 25);
ObservableList<PieChart.Data> list = FXCollections.observableArrayList(data1, data2, data3, data4, data5);
PieChart chart = new PieChart(list);
指示线长度
chart.setLabelLineLength(100);设置起始角度(未设置默认以向右射线顺时针分配区域,设置正数逆时针旋转,设置负数顺时针旋转)`chart.setStartAngle(90);
设置不显示指示线以及文本内容
chart.setLabelsVisible(false);设置初始分配时按照相反方向
chart.setClockwise(true);设置不显示下面的图示
chart.setLegendVisible(false);设置图示方位
chart.setLegendSide(Side.TOP);设置图题
chart.setTitle("这是图题");设置图题方位
chart.setTitleSide(Side.RIGHT);改变数据是否播放动画
chart.setAnimated(true);遍历饼图中的每一项数据
chart.getData().forEach(data -> {
  Node node = data.getNode();
  Tooltip tooltip = new Tooltip(data.getPieValue() + "");
  data.pieValueProperty().addListener((observable, oldValue, newValue) -> tooltip.setText(newValue.toString()));
  node.setOnMouseClicked(event -> System.out.println(data.getName() + "-" + data.getPieValue()));
  tooltip.setFont(new Font(20));
  Tooltip.install(node, tooltip);
});
效果图
引入css
scene.getStylesheets().add(Main.class.getClassLoader().getResource("css/chart.css").toExternalForm());外部css
.chart-pie.data0 {
    -fx-pie-color: #ffffcc;
    -fx-background-color: #ffffcc;
}
.chart {
    -fx-clockwise: false;
    -fx-pie-label-visible: true;
    -fx-label-line-length: 10;
    -fx-start-angle: 90;
}

/*设置图示*/
.chart-legend-item-symbol {
    -fx-pref-width: 100;
    -fx-pref-height: 30;
}